How to Read Cryptocurrency Price Charts: A Beginner’s Guide
Introduction: Why Understanding Price Charts Matters
Did you know that over 65% of crypto traders lose money due to misreading market signals? Whether you’re trading Bitcoin, Ethereum, or altcoins, learning how to read cryptocurrency price charts is the foundation of successful digital asset investing. This guide breaks down complex concepts into simple terms – think of it like learning to read a grocery store price tag, but for the blockchain economy.
1. The Basic Components of Crypto Charts
Candlestick Patterns: The Trader’s Alphabet
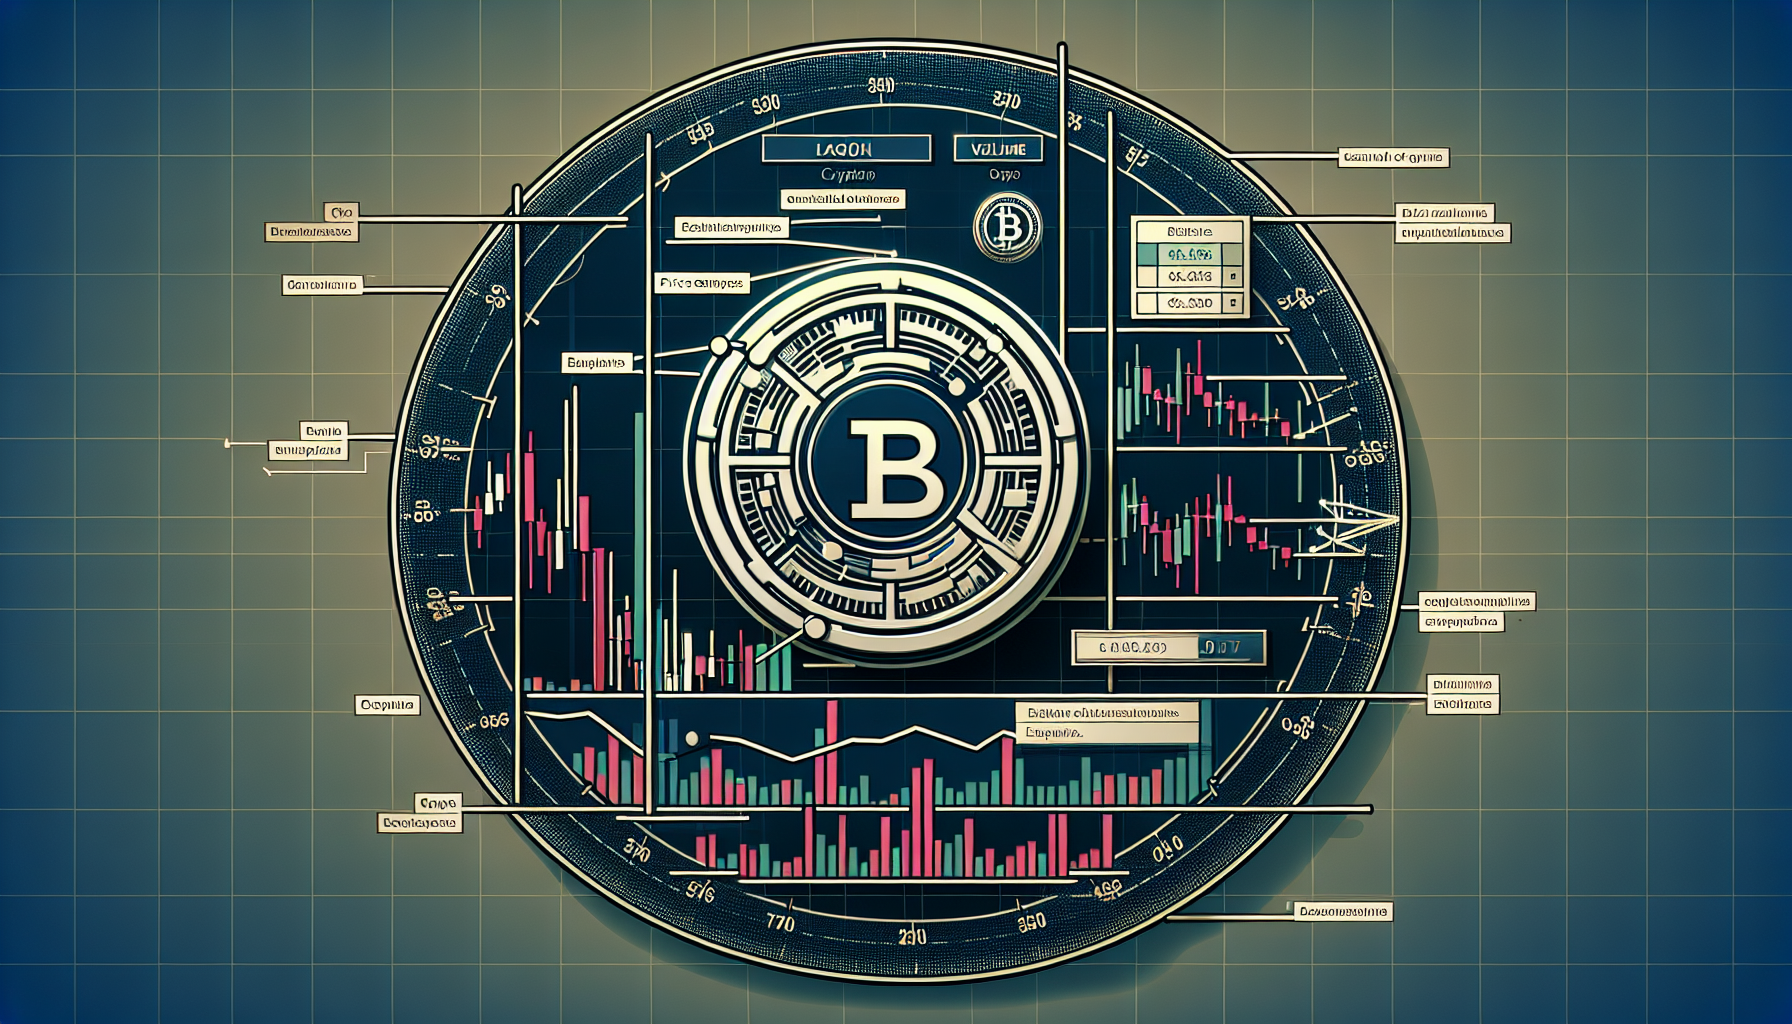
Each “candle” shows four key data points in cryptocurrency trading:
- Open/Close prices (body of the candle)
- High/Low prices (wick lines)
- Green candles = price rose
- Red candles = price fell
Pro Tip: Look for patterns like “hammer” (potential reversal) or “shooting star” (possible downturn).

Time Frames Matter
Switch between views:
- 1-minute charts for day trading
- 4-hour charts for swing trading
- Weekly charts for long-term investors
2. Key Indicators for Crypto Analysis
Volume: The Market’s Pulse
High trading volume confirms price movements. For example, if Bitcoin breaks resistance with low volume, it might be a false breakout.
Moving Averages: The Trend Spotters
The 50-day and 200-day moving averages help identify:
- Golden Cross (bullish signal)
- Death Cross (bearish warning)
3. Avoiding Common Chart Reading Mistakes
New traders often:
- Ignore multiple time frame confirmation
- Overreact to single candlestick patterns
- Forget to check blockchain transaction volumes (on-chain data)
Remember: Charts reflect market psychology – fear and greed create patterns.
4. Practical Tools for Better Analysis
Combine chart reading with:
- Relative Strength Index (RSI) for overbought/oversold signals
- Bollinger Bands to spot volatility changes
- Platforms like TradingView for advanced cryptocurrency technical analysis
Conclusion: Start Practicing Today
Mastering how to read cryptocurrency price charts takes practice, but it’s the difference between guessing and informed trading. For hands-on learning, try paper trading with historical data before risking real funds. Want to dive deeper? Explore our guide on essential technical analysis tools.
Disclaimer: Cryptocurrency trading carries risks. This content is educational only and not financial advice.
Cryptosaviours
Dr. Elena Rodriguez
Blockchain Analyst with 12 years experience
Author of 27 peer-reviewed papers on crypto economics
Lead auditor for the Luna Foundation security assessment


