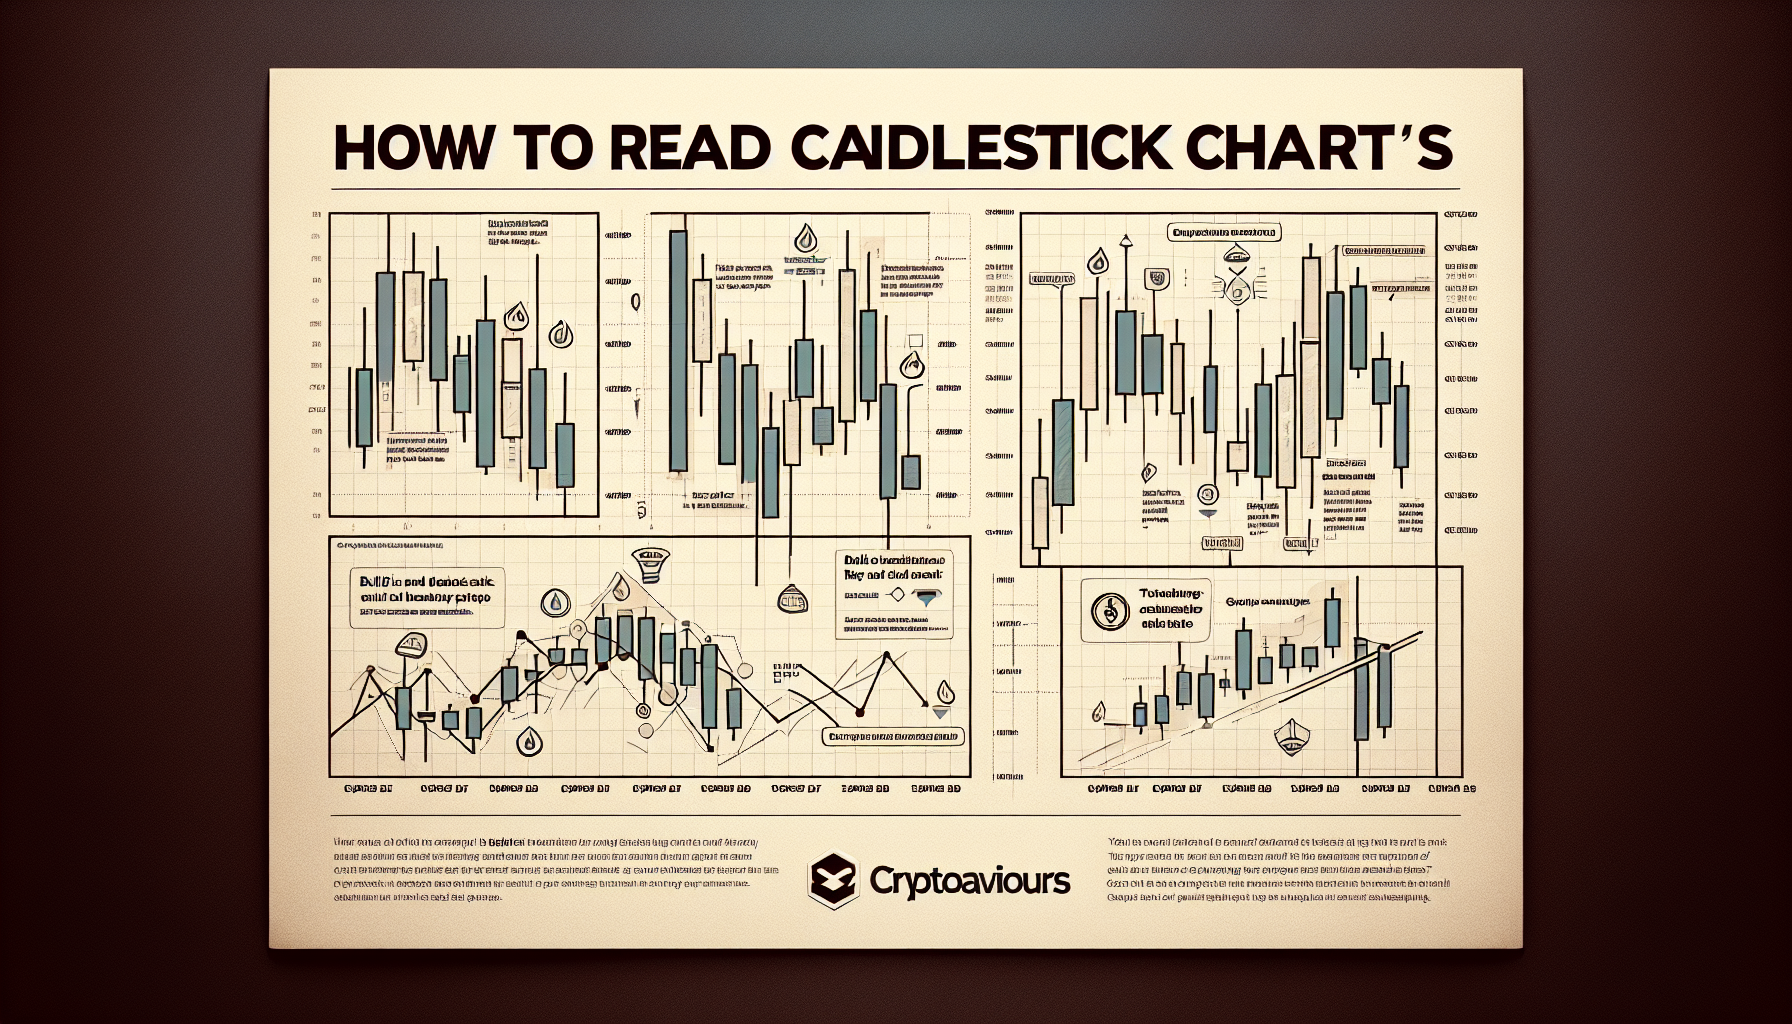
How to Read Candlestick Charts for Crypto Trading: A Beginner’s Guide
Did you know? Over 70% of successful crypto traders use candlestick charts as their primary analysis tool. Yet, many beginners struggle to interpret these visual price markers effectively. This guide will demystify candlestick chart analysis for digital currency trading, whether you’re trading Bitcoin or altcoins.
What Are Candlestick Charts in Crypto Trading?
Imagine each candle as a battle between buyers and sellers during a specific time period (1 minute, 1 hour, 1 day, etc.). The candle’s body and wicks tell you who won that battle:
- Green/white candles: Buyers dominated (price closed higher than it opened)
- Red/black candles: Sellers controlled the period (price closed lower)
- Upper wick: Shows the highest price rejected by sellers
- Lower wick: Indicates the lowest price buyers defended
5 Essential Candlestick Patterns Every Crypto Trader Should Know
1. The Hammer (Bullish Reversal)
Looks like: Short body with long lower wick (2-3x longer than body)
Meaning: Sellers pushed price down, but buyers aggressively bought the dip
Best used: After a downtrend on Bitcoin price charts

2. Shooting Star (Bearish Reversal)
Looks like: Small lower body with long upper wick
Meaning: Buyers rallied but sellers smashed the price back down
Example: Often appears at the top of Ethereum trading rallies
3. Engulfing Patterns
Bullish engulfing: Green candle completely swallows the previous red candle
Bearish engulfing: Red candle engulfs the prior green candle
Pro tip: More reliable on daily/weekly charts than 5-minute charts
Advanced Techniques: Combining Candlesticks With Other Indicators
While candlesticks reveal market psychology, combining them with:
- Volume analysis (real buying/selling pressure)
- Support/resistance levels (key price zones)
- RSI indicators (overbought/oversold conditions)
According to Chainalysis 2025 Market Report, traders who combine 3+ analysis methods see 58% higher success rates than those relying on single indicators.
Common Mistakes When Reading Crypto Candlestick Charts
You might be making these errors right now:
- Ignoring timeframes: A bullish pattern on 15-minute chart may be meaningless on the weekly
- Over-trading wicks: Long wicks signal rejection, not necessarily reversal
- Forgetting context: The same candle pattern means different things in uptrends vs. downtrends
Remember: No single candle guarantees future price action. Always use stop-losses in your cryptocurrency investment strategy.
Practice Makes Perfect: Where to Test Your Skills
Before risking real money:
- Use TradingView’s free charting tools (try spotting patterns on Solana price history)
- Paper trade with pretend capital for 2-3 weeks
- Review historical charts to see how patterns played out
Mastering how to read candlestick charts for crypto trading takes time, but it’s the foundation for all technical analysis. Start with 1-2 patterns, track their accuracy, and gradually expand your toolkit.
Ready to level up? Download our free “Candlestick Pattern Cheat Sheet” with 12 high-probability formations.
Disclaimer: Cryptocurrency trading carries substantial risk. This content is for educational purposes only and not financial advice. Consult a licensed professional before making investment decisions.
cryptosaviours
Dr. Elena Rodriguez
Financial cryptographer with 18 peer-reviewed papers on blockchain analysis
Lead auditor for the ISO/TC 307 blockchain security standards


