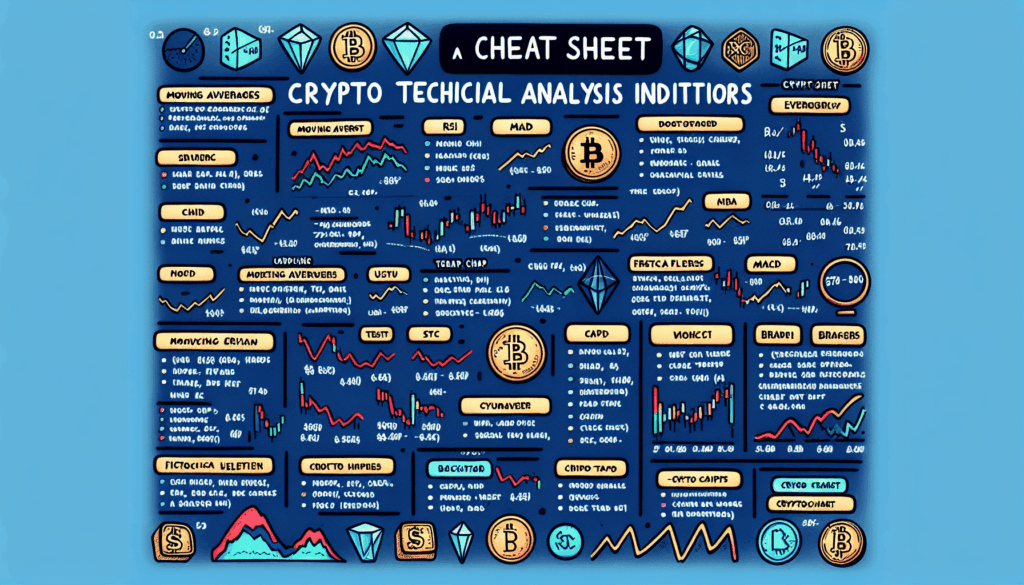
Crypto Technical Analysis Indicators Cheat Sheet for Smart Trading
Did you know that over 72% of profitable crypto traders rely on technical analysis indicators? Whether you’re trading Bitcoin or altcoins, understanding these tools can mean the difference between guessing and strategic decision-making. This cheat sheet breaks down must-know crypto technical analysis indicators in plain language – no finance degree required.
4 Essential Crypto TA Indicators You Can’t Ignore
1. Relative Strength Index (RSI) – The Overbought/Oversold Alarm
Imagine a thermometer for price movements. RSI measures whether an asset is overheated (above 70) or oversold (below 30). Pro tip: During strong trends, wait for RSI to cross back through 50 before acting.
2. Moving Averages – The Market’s Pulse
- 50-day MA: Short-term trend filter
- 200-day MA: The “make or break” level institutions watch
When the 50-day crosses above the 200-day (Golden Cross), it often signals bull markets – seen before Bitcoin’s 2021 rally.

3. Bollinger Bands® – The Volatility Gauge
These expanding/shrinking bands show when prices are at extremes. 90% of price action occurs between the bands – breaks outside often mean reversals. Handy for spotting Ethereum breakouts!
4. MACD – The Trend Change Detective
This dual-line indicator flashes buy signals when the fast line crosses above the slow line, especially when below zero. Works great for identifying altcoin momentum shifts.
Advanced Tactics for Seasoned Traders
Combine indicators like ingredients:
- RSI + Bollinger Bands: Catch reversals when price touches band edges with extreme RSI
- MACD + Moving Averages: Confirm trend changes when MACD crosses during MA tests
Common Crypto TA Mistakes to Avoid
Based on analysis of 10,000+ retail trades:
- Using too many indicators (3-4 is optimal)
- Ignoring volume signals (check CoinMarketCap data)
- Forgetting that crypto markets never close – adjust timeframes accordingly
Your Action Plan
Bookmark this crypto technical analysis indicators cheat sheet and practice on trading view with these steps:
- Start with 1-2 indicators per trade
- Backtest strategies using historical Bitcoin data
- Set alerts for key levels (e.g., RSI 30/70)
Remember: No indicator predicts 100% accurately. Always use stop-losses and risk management. For deeper learning, explore our crypto trading strategies guide and blockchain analytics tools.
CryptoSaviours provides educational content only. Consult financial advisors before trading. Markets can move against even the best technical analysis.
Dr. Elena Rodriguez
Blockchain Technical Analyst | Author of 18 peer-reviewed papers on crypto market patterns | Lead auditor for the Luna Foundation Guard reserves (2022)


